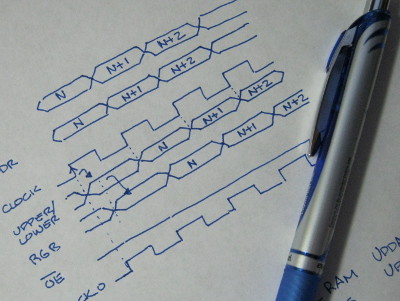
Unfortunately, timing diagrams are painful and time consuming to draw. They're also a pain to keep up to date as you modify your design. So they fall out of sync with your current prototype, at which point they no longer help the design process (and can, in fact, hinder it by propagating a false view of how the circuit operates). Then you have to try and update them at the end of the project, probably misremembering a few details along the way.
It would help if there was a simple way to describe timing waveforms instead of trying to draw all the fiddly bits using a generic drawing program. This is where WaveDrom comes in. It uses a simple JSON syntax like this:
{ signal: [
  { name: "clk_i",     wave: 'P...' },
  { name: 'add_i',     wave: '010.' },
  { name: 'data_i',    wave: 'x=x.', data:["data"] },
  { name: 'upEmpty_o', wave: 'x.0.' },
  { name: 'upFull_o',  wave: '0.x.' },
  { name: 'upLevel_o', wave: '=.=.', data:["N","N+1"] },
  ],
  config: {hscale: 2},
  head: {text: 'Up FIFO Push Example', tick:0,}
}
to create timing diagrams like this:
The waveform objects that make up the timing diagram are contained in the signal:[...] JSON array.
In the simplest case, each waveform object has a name field and a wave field.
The value in the wave field is just a string of characters where each character represents the
logic level of the wave during a single time slot.
The meanings of the characters are as follows:
| Character | Meaning |
|---|---|
| p | Clock pulse with positive polarity (i.e., starts off at a logic high and transitions to a logic low. |
| P | Positive polarity clock pulse with an arrow drawn on the rising edge. |
| n | Clock pulse with negative polarity (i.e., starts off at a logic low and transitions to a logic high. |
| N | Negative polarity clock pulse with an arrow drawn on the falling edge. |
| l, 0 | Low logic level. |
| L | Low logic level with an arrow drawn on the falling edge. |
| d | Low logic level maintained by a pulldown resistor. |
| h, 1 | High logic level. |
| H | High logic level with an arrow drawn on the rising edge. |
| u | High logic level maintained by a pullup resistor. |
| x | Unknown logic level or bus value. |
| z | Tri-state (undriven) logic level. |
| =, 2 | Digital bus value with white fill color. |
| 3, 4, 5 | Digital bus value with various fill colors. |
| . | Repeat the previous value of the waveform. |
Probably the most used character is the period, which just repeats the last value of the waveform.
For example, wave: 'p....' would draw five, consecutive, positive-polarity pulses like so:
Or wave: '1..0...=.' would draw a waveform that is high for three periods, low for four periods,
and then displays a bus value for two periods like this:
Note that using the period is not the same as just repeating the character.
Here's what the previous example looks like if you use wave: '1110000==' instead:
It's nice to be able to label waveforms for digital buses with the values they carry.
That can be done using a data field whose consecutive values are inserted into the
bus waveform as each = sign is encountered.
For example, this wave: '=..=...=.', data:['N','N+1','N+2'] results in this:
It also works if you replace the = with a character for one of the colored buses like this
wave: '3..4...5.', data:['N','N+1','N+2']
I've only shown a fraction of what WaveDrom can do. I haven't even touched on these features:
You can learn more by reading the WaveDrom tutorial. There's even a live WaveDrom editor page where you can type in JSON code to try out the various features.
If you decide you like WaveDrom (and, really, who wouldn't!?), there are two ways to use it. The first is in an off-line mode for generating timing diagrams to include in your documents. First, download an archive of the WaveDrom editor for your particular OS. Unpack it into a directory and run the executable. Then you can type in JSON code and see the resulting waveforms just like you did on the live editor web page. You can export your timing diagram as either a PNG image or as an SVG file. The interesting thing is that you can open the SVG file with a graphic editor like Inkscape and modify the drawing. This is useful if there is some formatting you absolutely need that WaveDrom can't provide.
The second option is to use the WaveDrom Javascript library to show timing diagrams in your web pages.
Get the WaveDrom.js file and the skins directory from the
WaveDrom Github page.
Place these files somewhere that your web server can find them.
Then load the Javascript libraries by placing the following into the
<head>...</head> section of your web page:
    <script src="your_website_path/skins/default.js"></script>
    <script src="your_website_path/WaveDrom.js"></script>
Next, place the following call to the timing waveform rendering function at the bottom of your web page:
(function(){ window.addEventListener("load", WaveDrom.ProcessAll, false); })();
Then you can draw a timing diagram anywhere in your page by inserting JSON code
inside a <script type="WaveDrom">...</script> bracket like this:
    <script type="WaveDrom">
    { signal: [
      { name: "clk_i",     wave: 'P...' },
      { name: 'add_i',     wave: '010.' },
      { name: 'data_i',    wave: 'x=x.', data:["data"] },
      { name: 'upEmpty_o', wave: 'x.0.' },
      { name: 'upFull_o',  wave: '0.x.' },
      { name: 'upLevel_o', wave: '=.=.', data:["N","N+1"] },
      ],
      config: {hscale: 2},
      head: {text: 'Up FIFO Push Example', tick:0,}
    }
    </script>
After you reload the web page, you should see the same figure shown at the beginning of this article.
Share on Twitter Share on Facebook Share on Reddit
Comments
New Comment